Architecture of Facette
Facette is a time series data (called metrics) visualization software, it doesn’t collect nor store these data on its own. Through providers, it inventories other collect/storage tools’ local metrics, and queries those remote storage resources when the user requests time series data to be displayed on a graph.
The Big Picture
Here is the big picture showing how Facette and its components are architectured, and how they interact with external resources:
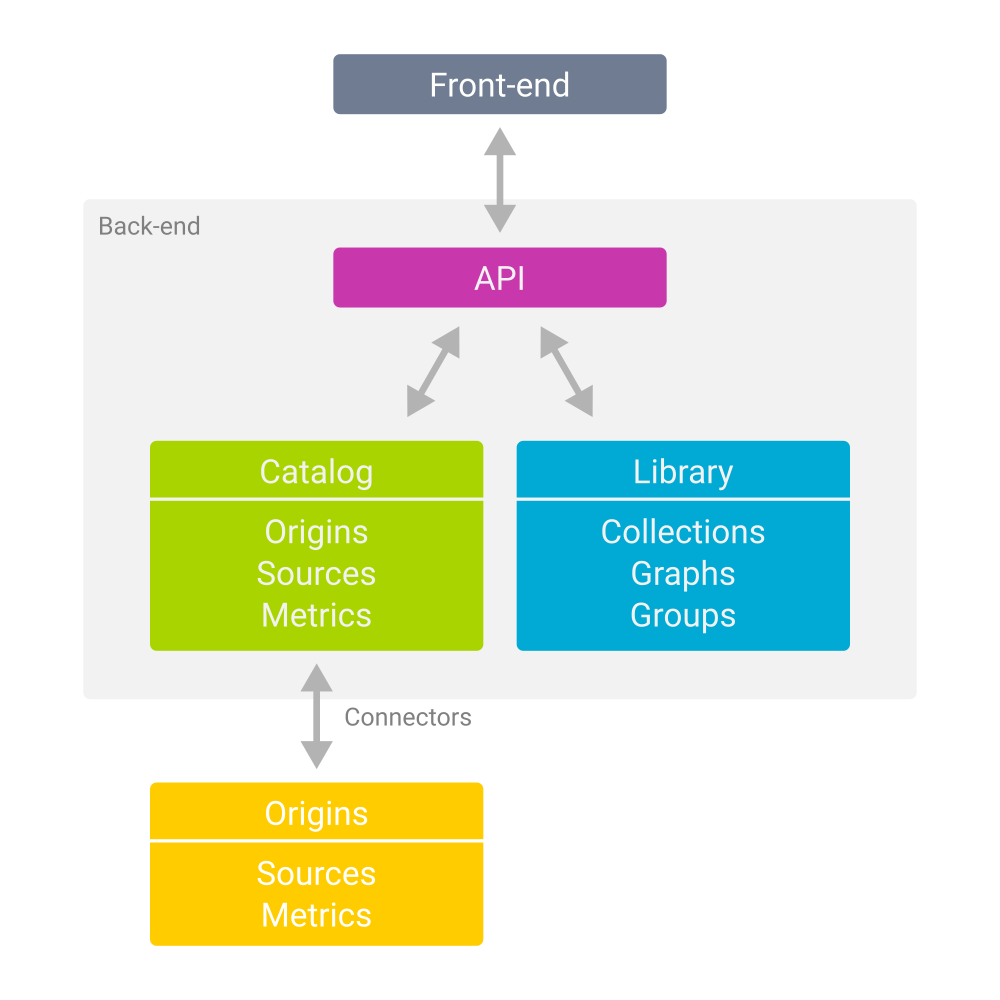
Facette consists of two main components: the front-end and the back-end. The back-end is the component that interacts via connectors with the resources actually storing time series data — called origins — or being the canonical interface to access them; the front-end is a web application – only making API calls to the back-end – that displays time series data on graphs.
The Catalog
Facette maintains an internal inventory of known sources and metrics from configured origins called the catalog. Here is a bit of terminology used in the software:
Origin
An origin represents, as its name suggests, the origin of the back-end time series (e.g. collectd, Munin, Graphite, KairosDB, InfluxDB etc). Those origins hold local sets of sources and metrics.
Source
A source represents an entity that generates metrics. These are usually host names, but can be services or applications names.
Metric
A metric is a set of time-based data points (e.g. RRDtool files) measured or collected by any monitoring or metering/profiling tool, that will be eventually displayed on graphs in Facette.